Examples of utilisation
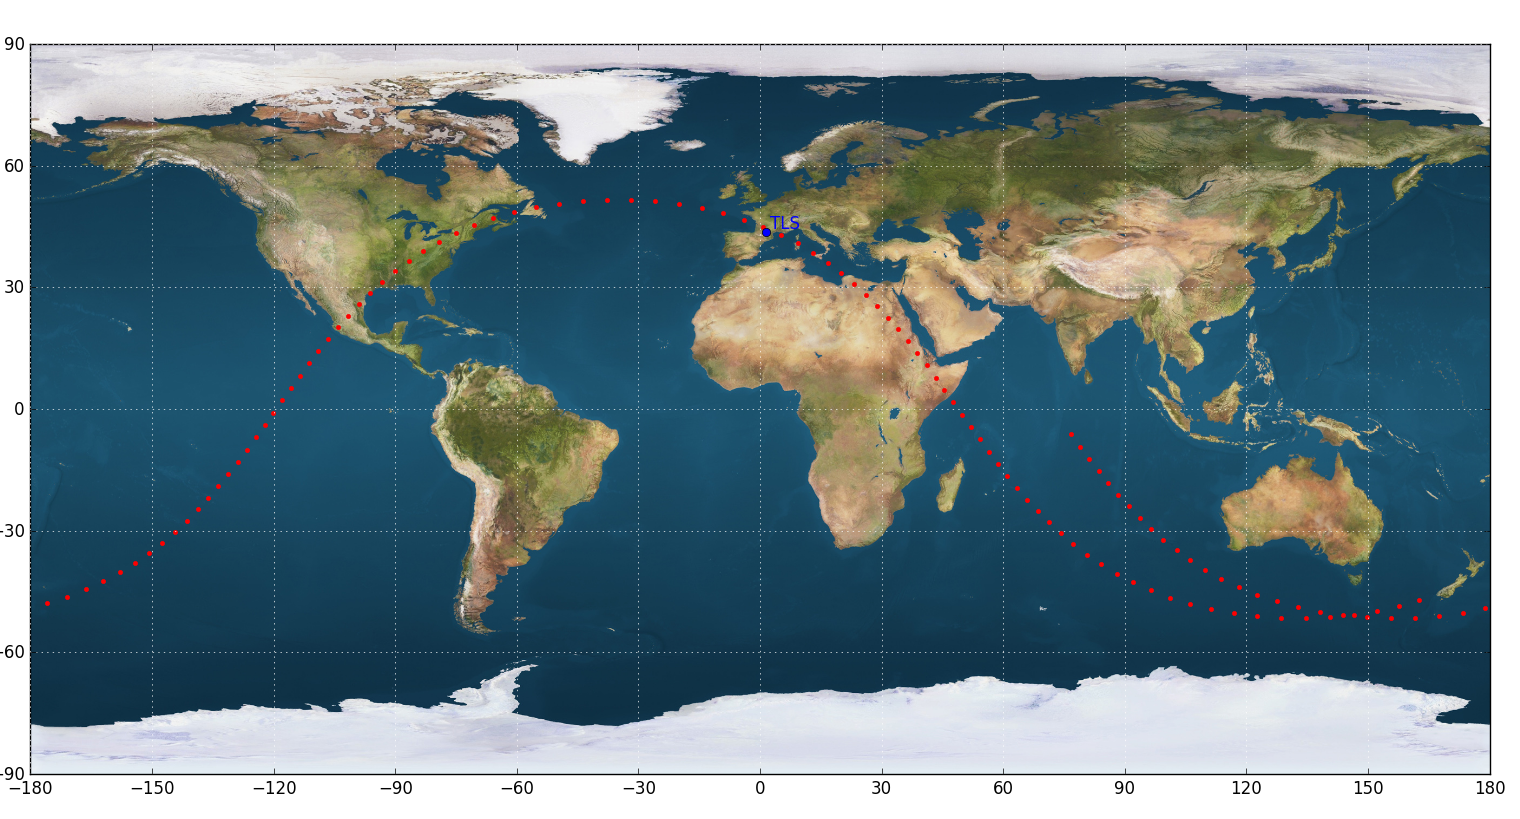
Ground track
#!/usr/bin/env python

"""Script showing the position of the ISS at the time of the TLE
and the ground track for the previous and the next orbit
"""

import sys
import numpy as np
import matplotlib.pyplot as plt
from pathlib import Path

from beyond.io.tle import Tle
from beyond.dates import Date, timedelta


# Parsing of TLE
tle = Tle("""ISS (ZARYA)
1 25544U 98067A   19004.59354167  .00000715  00000-0  18267-4 0  9995
2 25544  51.6416  95.0104 0002419 236.2184 323.8248 15.53730729149833""")

# Conversion into `Orbit` object
orb = tle.orbit()

# Tables containing the positions of the ground track
latitudes, longitudes = [], []
prev_lon, prev_lat = None, None

period = orb.infos.period
start = orb.date - period
stop = 2 * period
step = period / 100

for point in orb.ephemeris(start=start, stop=stop, step=step):

    # Conversion to earth rotating frame
    point.frame = 'ITRF'

    # Conversion from cartesian to spherical coordinates (range, latitude, longitude)
    point.form = 'spherical'

    # Conversion from radians to degrees
    lon, lat = np.degrees(point[1:3])

    # Creation of multiple segments in order to not have a ground track
    # doing impossible paths
    if prev_lon is None:
        lons = []
        lats = []
        longitudes.append(lons)
        latitudes.append(lats)
    elif orb.i < np.pi /2 and (np.sign(prev_lon) == 1 and np.sign(lon) == -1):
        lons.append(lon + 360)
        lats.append(lat)
        lons = [prev_lon - 360]
        lats = [prev_lat]
        longitudes.append(lons)
        latitudes.append(lats)
    elif orb.i > np.pi/2 and (np.sign(prev_lon) == -1 and np.sign(lon) == 1):
        lons.append(lon - 360)
        lats.append(lat)
        lons = [prev_lon + 360]
        lats = [prev_lat]
        longitudes.append(lons)
        latitudes.append(lats)

    lons.append(lon)
    lats.append(lat)
    prev_lon = lon
    prev_lat = lat

img = Path(__file__).parent / "earth.png"

im = plt.imread(str(img))
plt.figure(figsize=(15.2, 8.2))
plt.imshow(im, extent=[-180, 180, -90, 90])

for lons, lats in zip(longitudes, latitudes):
    plt.plot(lons, lats, 'r')

lon, lat = np.degrees(orb.copy(frame='ITRF', form='spherical')[1:3])
plt.plot([lon], [lat], 'ro')

plt.xlim([-180, 180])
plt.ylim([-90, 90])
plt.grid(True, color='w', linestyle=":", alpha=0.4)
plt.xticks(range(-180, 181, 30))
plt.yticks(range(-90, 91, 30))
plt.tight_layout()

if "no-display" not in sys.argv:
    plt.show()
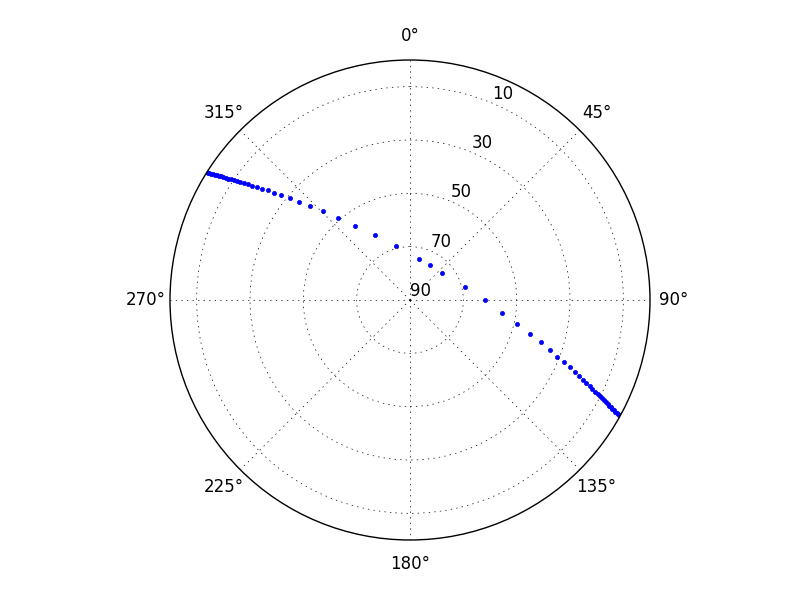
Station pointings
#!/usr/bin/env python

import sys
import numpy as np
import matplotlib.pyplot as plt

from beyond.dates import Date, timedelta
from beyond.io.tle import Tle
from beyond.frames import create_station
from beyond.config import config


tle = Tle("""ISS (ZARYA)
1 25544U 98067A   16086.49419020  .00003976  00000-0  66962-4 0  9998
2 25544  51.6423 110.4590 0001967   0.7896 153.8407 15.54256299992114""").orbit()

# Station definition
station = create_station('TLS', (43.428889, 1.497778, 178.0))
azims, elevs = [], []

print("    Time      Azim    Elev    Distance   Radial Velocity")
print("=========================================================")

for orb in station.visibility(tle, start=Date.now(), stop=timedelta(hours=24), step=timedelta(seconds=30), events=True):
    elev = np.degrees(orb.phi)
    # Radians are counterclockwise and azimuth is clockwise
    azim = np.degrees(-orb.theta) % 360

    # Archive for plotting
    azims.append(azim)
    # Matplotlib actually force 0 to be at the center of the polar plot,
    # so we trick it by inverting the values
    elevs.append(90 - elev)

    r = orb.r / 1000.
    print("{event:7} {orb.date:%H:%M:%S} {azim:7.2f} {elev:7.2f} {r:10.2f} {orb.r_dot:10.2f}".format(
        orb=orb, r=r, azim=azim, elev=elev, event=orb.event.info if orb.event is not None else ""
    ))

    if orb.event and orb.event.info.startswith("LOS"):
        # We stop at the end of the first pass
        print()
        break

plt.figure()
ax = plt.subplot(111, projection='polar')
ax.set_theta_direction(-1)
ax.set_theta_zero_location('N')
plt.plot(np.radians(azims), elevs, '.')
ax.set_yticks(range(0, 90, 20))
ax.set_yticklabels(map(str, range(90, 0, -20)))
ax.set_rmax(90)

if "no-display" not in sys.argv:
    plt.show()
    Time      Azim    Elev    Distance   Radial Velocity
=========================================================
AOS 02:01:23  302.10   -0.00    2312.91   -6906.48
    02:01:39  302.30    1.00    2204.46   -6904.71
    02:02:09  302.71    3.07    1997.46   -6894.10
    02:02:39  303.20    5.39    1790.94   -6870.86
    02:03:09  303.79    8.08    1585.39   -6829.11
    02:03:39  304.54   11.30    1381.49   -6758.37
    02:04:09  305.53   15.29    1180.37   -6638.85
    02:04:39  306.94   20.51     984.03   -6430.17
    02:05:09  309.17   27.78     796.31   -6042.60
    02:05:39  313.28   38.63     625.31   -5262.66
    02:06:09  323.59   55.36     489.17   -3610.39
    02:06:39   12.81   74.28     423.23    -565.54
MAX 02:06:43   30.39   75.00     421.90       0.00
    02:07:09   90.23   61.99     458.89    2806.46
    02:07:39  105.74   43.24     577.62    4871.54
    02:08:09  111.00   30.79     740.40    5857.82
    02:08:39  113.63   22.61     924.12    6336.73
    02:09:09  115.23   16.86    1118.38    6588.72
    02:09:39  116.32   12.54    1318.37    6730.93
    02:10:09  117.12    9.12    1521.66    6814.75
    02:10:39  117.74    6.29    1726.92    6864.71
    02:11:09  118.24    3.86    1933.33    6893.49
    02:11:39  118.65    1.72    2140.39    6908.11
LOS 02:12:05  118.97    0.01    2323.42    6912.59
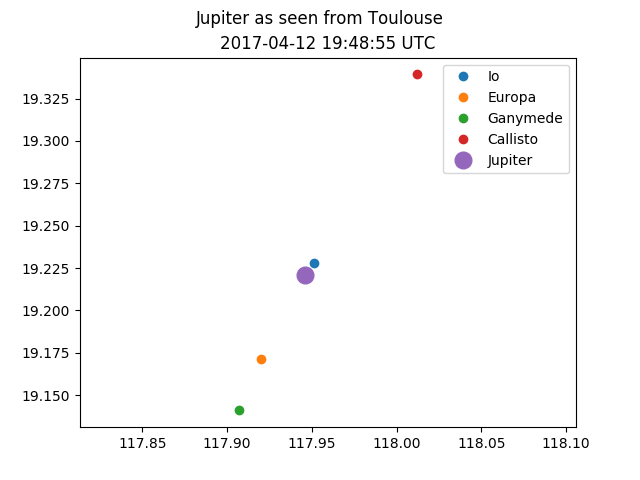
Jupiter and its moons
"""Follow the informations provided in the `beyond.env.jpl` module about configuration
in order to supply the data needed.
"""

import numpy as np
import matplotlib.pyplot as plt

from beyond.dates import Date
from beyond.env import jpl
from beyond.frames import create_station
from beyond.config import config

# Load the ".bsp" file
config.update({
    "env": {
        "jpl": {
            "files" :[
                "/home/jules/.space/jpl/jup310.bsp"
            ]
        }
    }
})


date = Date.now()

# Definition of the location of observation
station = create_station('TLS', (43.428889, 1.497778, 178.0))

jpl.create_frames()

# Retrieve Jupiter and its moons state-vectors
jupiter = jpl.get_orbit('Jupiter', date)
io = jpl.get_orbit('Io', date)
europa = jpl.get_orbit('Europa', date)
ganymede = jpl.get_orbit('Ganymede', date)
callisto = jpl.get_orbit('Callisto', date)

# Convert them to the observer frame
jupiter.frame = station
io.frame = station
europa.frame = station
ganymede.frame = station
callisto.frame = station

# Change the orbit form in order to get azimuth and elevation
europa.form = 'spherical'
io.form = 'spherical'
ganymede.form = 'spherical'
callisto.form = 'spherical'
jupiter.form = 'spherical'

plt.figure()

# The size of the dots is not on scale
plt.plot([-np.degrees(io.theta)], [np.degrees(io.phi)], 'o', zorder=-io.r, label="Io")
plt.plot([-np.degrees(europa.theta)], [np.degrees(europa.phi)], 'o', zorder=-europa.r, label="Europa")
plt.plot([-np.degrees(ganymede.theta)], [np.degrees(ganymede.phi)], 'o', zorder=-ganymede.r, label="Ganymede")
plt.plot([-np.degrees(callisto.theta)], [np.degrees(callisto.phi)], 'o', zorder=-callisto.r, label="Callisto")
plt.plot([-np.degrees(jupiter.theta)], [np.degrees(jupiter.phi)], 'o', zorder=-jupiter.r, ms=12, label="Jupiter")

plt.suptitle("Jupiter as seen from Toulouse")
plt.title(f"{date:%Y-%m-%d %H:%M:%S UTC}")
plt.legend()
plt.axis('equal')
plt.show()
Listeners
#!/usr/bin/env python

from beyond.dates import Date, timedelta
from beyond.io.tle import Tle
from beyond.frames import create_station
from beyond.propagators.listeners import stations_listeners, NodeListener, ApsideListener, LightListener


tle = Tle("""ISS (ZARYA)
1 25544U 98067A   17153.89608442  .00001425  00000-0  28940-4 0  9997
2 25544  51.6419 109.5559 0004850 223.1783 180.8272 15.53969766 59532""").orbit()

# Station definition
station = create_station('TLS', (43.428889, 1.497778, 178.0))

# Listeners declaration
listeners = stations_listeners(station)  # AOS, LOS and MAX elevation
listeners.append(NodeListener())         # Ascending and Descending Node
listeners.append(ApsideListener())       # Apogee and Perigee
listeners.append(LightListener())        # Illumination events

start = Date.now()
stop = timedelta(minutes=100)
step = timedelta(seconds=180)

for orb in tle.iter(start=start, stop=stop, step=step, listeners=listeners):
    event = orb.event if orb.event is not None else ""
    print(f"{orb.date:%Y-%m-%d %H:%M:%S} {event}")
2017-06-03 21:39:11
2017-06-03 21:42:11
2017-06-03 21:45:11
2017-06-03 21:48:11
2017-06-03 21:51:11
2017-06-03 21:52:37 Apogee
2017-06-03 21:54:11
2017-06-03 21:57:11
2017-06-03 22:00:11
2017-06-03 22:00:43 AscNode
2017-06-03 22:03:11
2017-06-03 22:06:11
2017-06-03 22:09:11
2017-06-03 22:12:11
2017-06-03 22:15:11
2017-06-03 22:18:11
2017-06-03 22:21:11
2017-06-03 22:24:11
2017-06-03 22:25:14 AOS TLS
2017-06-03 22:27:11
2017-06-03 22:28:16 Perigee
2017-06-03 22:30:11
2017-06-03 22:30:25 Umbra in
2017-06-03 22:30:36 MAX TLS
2017-06-03 22:33:11
2017-06-03 22:35:57 LOS TLS
2017-06-03 22:36:11
2017-06-03 22:39:11
2017-06-03 22:42:11
2017-06-03 22:45:11
2017-06-03 22:46:59 DscNode
2017-06-03 22:48:11
2017-06-03 22:51:11
2017-06-03 22:54:11
2017-06-03 22:57:11
2017-06-03 23:00:11
2017-06-03 23:03:11
2017-06-03 23:03:18 Umbra out
2017-06-03 23:06:11
2017-06-03 23:09:11
2017-06-03 23:12:11
2017-06-03 23:15:11
2017-06-03 23:18:11
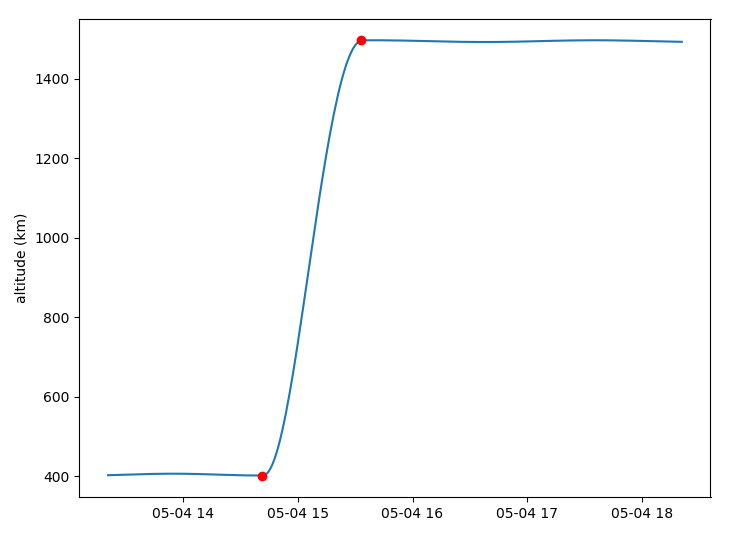
Maneuvers
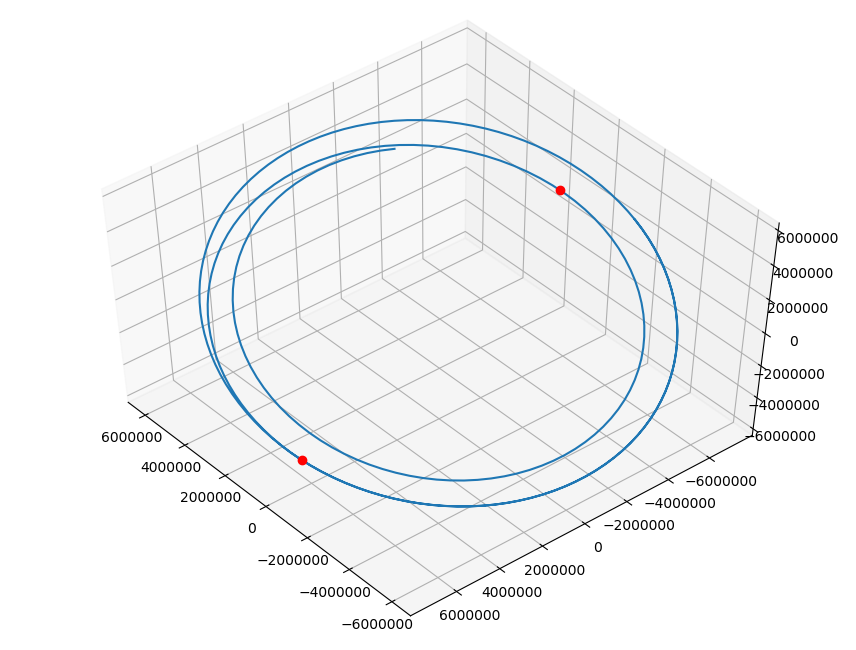
"""Example of Hohmann transfer

The orbit we are starting with is a Tle of the ISS. The amplitude of the maneuver is greatly
exagerated regarding the ISS's capability, but has the convenience to be particularly visual.
"""

import sys
import numpy as np
import matplotlib.pyplot as plt
from mpl_toolkits.mplot3d import Axes3D

from beyond.io.tle import Tle
from beyond.dates import timedelta
from beyond.propagators.numerical import KeplerNum
from beyond.env.solarsystem import get_body
from beyond.orbits.man import ImpulsiveMan
from beyond.propagators.listeners import ApsideListener, find_event


orb = Tle("""ISS (ZARYA)
1 25544U 98067A   18124.55610684  .00001524  00000-0  30197-4 0  9997
2 25544  51.6421 236.2139 0003381  47.8509  47.6767 15.54198229111731""").orbit()

start = orb.date
stop = timedelta(minutes=300)
step = timedelta(seconds=60)

# Changing the propagator to Keplerian, as SGP4 is not able to perform maneuvers
orb.propagator = KeplerNum(step, bodies=get_body("Earth"))

# Research for the next perigee
perigee = find_event(orb.iter(stop=stop, listeners=ApsideListener()), 'Periapsis')

man1 = ImpulsiveMan(perigee.date, (280, 0, 0), frame="TNW")
orb.maneuvers = [man1]

dates1, alt1 = [], []

# Research for the next apogee after the first maneuver
apogee = find_event(orb.iter(start=perigee.date - step * 10, stop=stop, listeners=ApsideListener()), 'Apoapsis')
# apogee = find_event(orb.iter(stop=stop, listeners=ApsideListener()), 'Apoapsis', offset=1)

# Adding the second maneuver to the orbit
man2 = ImpulsiveMan(apogee.date, (270, 0, 0), frame="TNW")
orb.maneuvers.append(man2)

print(man1.date)
print(man2.date)

# Propagation throught the two maneuvers
ephem = orb.ephem(start=start, stop=stop, step=step)

# graphs
plt.figure()

data = np.array(ephem)
dates = [x.date for x in ephem]
# Altitude in km
alt = (np.linalg.norm(data[:, :3], axis=1) - orb.frame.center.body.r) / 1000
events_dates = [perigee.date, apogee.date]
events_alt = (np.linalg.norm([perigee[:3], apogee[:3]], axis=1) - orb.frame.center.body.r) / 1000

plt.plot(dates, alt)
plt.plot([events_dates[0]], [events_alt[0]], 'ro', label="perigee")
plt.plot([events_dates[1]], [events_alt[1]], 'ko', label="apogee")

plt.ylabel("altitude (km)")
plt.legend()
plt.grid(linestyle=':', alpha=0.4)
plt.tight_layout()

fig = plt.figure()
ax = plt.subplot(projection='3d')
ax.view_init(elev=52, azim=140)

x, y, z = zip(perigee[:3], apogee[:3])

plt.plot(data[:, 0], data[:, 1], data[:, 2])
plt.plot([perigee[0]], [perigee[1]], [perigee[2]], 'ro')
plt.plot([apogee[0]], [apogee[1]], [apogee[2]], 'ko')

if "no-display" not in sys.argv:
    plt.show()
2018-05-04T14:41:09.984493 UTC
2018-05-04T15:33:11.374985 UTC
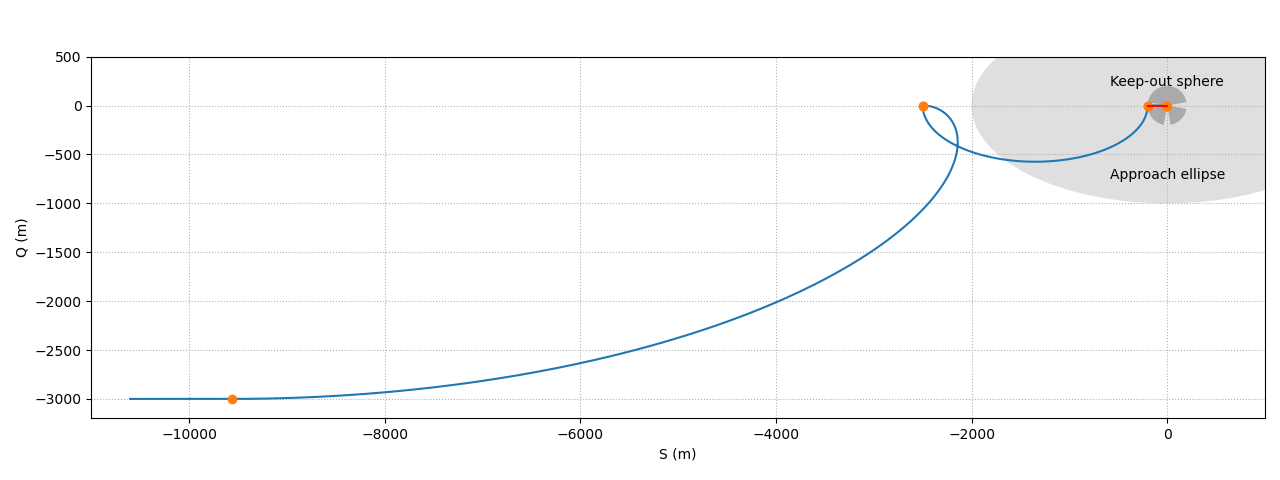
Docking
"""Example script for docking to the ISS, starting from an orbit 3000 m below

This script uses the V-bar approach strategy, with an approach ellipse at 2000
meters and a keep-out sphere at 200 meters.
"""

import sys
import numpy as np
import matplotlib.pyplot as plt
import matplotlib.dates as mdates
import matplotlib.patches as mpatches

from beyond.dates import Date, timedelta
from beyond.orbits import Orbit
from beyond.propagators.rpo import ClohessyWiltshire
from beyond.utils.rpohelper import RpoHelper
from beyond.propagators.listeners import Listener, Event, find_event
from beyond.orbits.man import ImpulsiveMan, ContinuousMan


class TangentialDistanceListener(Listener):
    """This listener is useful to detect the exact time at which to
    start the Hohmann transfer in order to place the chaser spacecraft
    at the first hold point
    """

    def __init__(self, delta, orientation="QSW"):
        self.delta = delta
        self.orientation = orientation

    def info(self, orb):
        return Event(self, "go")

    def __call__(self, orb):
        idx = 1 if self.orientation == "QSW" else 0
        return orb[idx] - self.delta


propagator = ClohessyWiltshire(6378000 + 410000)
helper = RpoHelper(propagator)

radial = -3000  # radial distance at the beginning of the simulation
date = Date(Date.now().d)
step = timedelta(seconds=10)
hold_points = [
    -2500,  # First hold point well outside the approach ellipse
    -200,  # Second hold point just outside the keep-out sphere
    -10,  # Last hold point close to the docking port for the last checks
]
hold = timedelta(minutes=10)  # hold duration
linear_dv = 0.5  # Proximity linear velocity
final_dv = 0.1  # Final linear velocity for docking
duration = helper.period * 3

# Tangential distance necessary for a Hohmann transfer
tangential = helper.hohmann_distance(radial)

# Initial orbit
orb = helper.coelliptic(date, radial, tangential * 1.5)

# Search for the point of desired maneuver in order to arrive at the
# first hold point
ephem = orb.ephem(
    step=step,
    stop=helper.period * 2,
    listeners=TangentialDistanceListener(
        tangential + hold_points[0], helper.frame.orientation
    ),
)
start_man = find_event(ephem, "go")

# Creation of the two impulsive maneuvers that place the spacecraft at the
# first hold point (at 2500 m)
orb.maneuvers.extend(helper.hohmann(-radial, start_man.date))

# Eccentric boost in order to go to the next hold point (at 200 m)
orb.maneuvers.extend(
    helper.eccentric_boost(
        hold_points[1] - hold_points[0], orb.maneuvers[-1].date + hold
    )
)

# Linear maneuver at 0.5 m/s to reach the next hold point (at 10 m)
orb.maneuvers.extend(
    helper.vbar_linear(
        hold_points[2] - hold_points[1], orb.maneuvers[-1].date + hold, linear_dv
    )
)

# Final maneuver at 0.1 m/s to reach the docking port
orb.maneuvers.extend(
    helper.vbar_linear(-hold_points[2], orb.maneuvers[-1].date + hold, final_dv)
)

chaser_ephem = orb.ephem(step=step, stop=duration)
dates = list(chaser_ephem.dates)
result = np.asarray(chaser_ephem)

# Display the trajectory
print("Final position")
print(f"Q = {chaser_ephem[-1, 0]: 7.3f}")
print(f"S = {chaser_ephem[-1, 1]: 7.3f}")
print(f"W = {chaser_ephem[-1, 2]: 7.3f}")

man_dates = [man.date for man in orb.maneuvers if isinstance(man, ImpulsiveMan)]
cont_man = [man for man in orb.maneuvers if isinstance(man, ContinuousMan)]
mans = np.array([chaser_ephem.propagate(d) for d in man_dates])

plt.figure(figsize=(12.8, 4.8))
ax = plt.subplot(111)

# Approach sphere (2 km)
circle = mpatches.Ellipse((0, 0), 4000, 2000, ec="none", fc="#aaaaaa60")
ax.add_patch(circle)

# Keep out sphere (200 m) with corridors
w1 = mpatches.Wedge((0, 0), 200, theta1=-170, theta2=-100, ec="none", fc="#aaaaaa")
w2 = mpatches.Wedge((0, 0), 200, theta1=-80, theta2=-10, ec="none", fc="#aaaaaa")
w3 = mpatches.Wedge((0, 0), 200, theta1=10, theta2=170, ec="none", fc="#aaaaaa")
ax.add_patch(w1)
ax.add_patch(w2)
ax.add_patch(w3)

plt.text(0, -750, "Approach ellipse", ha="center")
plt.text(0, 200, "Keep-out sphere", ha="center")

plt.plot(chaser_ephem[:, 1], chaser_ephem[:, 0])
if len(mans):
    plt.plot(mans[:, 1], mans[:, 0], "o")

for man in cont_man:
    subeph = chaser_ephem.ephem(start=man.start, stop=man.stop, step=step)
    plt.plot(subeph[:, 1], subeph[:, 0], "r")

plt.xlabel("S (m)")
plt.ylabel("Q (m)")
ax.set_aspect("equal")
plt.grid(ls=":")
plt.xlim(-11000, 1000)
plt.ylim(-3200, 500)
plt.tight_layout()

if "no-display" not in sys.argv:
    plt.show()
Final position
Q =   0.000
S =   0.000
W =   0.000
Yamanaka-Ankersen
"""Reproducing the figures on the original Yamanaka-Ankersen paper

New State Transition Matrix for Relative Motion on an Arbitrary Elliptical Orbit
Koji Yamanaka and Finn Ankersen.
Journal of Guidance, Control, and Dynamics 25, no. 1 (January 2002): 60–66.
https://doi.org/10.2514/2.4875.
"""

import sys
import numpy as np
import matplotlib.pyplot as plt

from beyond.propagators.rpo import YamanakaAnkersen, ClohessyWiltshire
from beyond.frames.frames import HillFrame
from beyond.orbits import Orbit
from beyond.dates import Date, timedelta
from beyond.constants import Earth

date = Date(2023, 11, 26)

alt = 500_000
rp = alt + Earth.r
i = np.radians(30)
nu = np.radians(45)

for i, e in enumerate([0.1, 0.7]):
    a = rp / (1 - e)

    target = Orbit([a, e, i, 0, 0, nu], date, "keplerian", "EME2000", "Kepler")

    stop = 2 * target.infos.period
    step = timedelta(seconds=60)

    ephem_target = target.ephem(stop=stop, step=step).copy(form="keplerian")

    prop_ya = YamanakaAnkersen(target)
    prop_cw = ClohessyWiltshire.from_orbit(target, orientation="LVLH")
    orb_cw = Orbit(
        [100, 10, 10, 0.1, 0.1, 0.1],
        target.date,
        form="cartesian",
        frame=HillFrame("LVLH"),
        propagator=prop_cw,
    )

    orb_ya = orb_cw.as_orbit(prop_ya)

    ephem_cw = orb_cw.ephem(stop=stop, step=step)
    ephem_ya = orb_ya.ephem(stop=stop, step=step)

    print(repr(ephem_ya[-1]))

    plt.figure(figsize=(10, 6))

    plt.subplot(121)

    plt.plot(ephem_cw[:, 0], ephem_cw[:, 2], label="CW")
    plt.plot(ephem_ya[:, 0], ephem_ya[:, 2], label="YA")
    plt.plot(0, 0, "r+", label="target")
    plt.grid(ls=":")
    plt.gca().invert_xaxis()
    plt.gca().invert_yaxis()
    plt.legend()
    plt.xlabel("X (m)")
    plt.ylabel("Z (m)")

    plt.subplot(122)

    plt.plot(ephem_cw[:, 0], ephem_cw[:, 1], label="CW")
    plt.plot(ephem_ya[:, 0], ephem_ya[:, 1], label="YA")
    plt.plot(0, 0, "r+", label="target")
    plt.grid(ls=":")
    plt.gca().invert_xaxis()
    # plt.gca().invert_yaxis()
    plt.legend()
    plt.xlabel("X (m)")
    plt.ylabel("Y (m)")

    plt.suptitle(f"perigee = {alt / 1000:0.1f} km / e = {e:0.1f}")

    plt.tight_layout()

if "no-display" not in sys.argv:
    plt.show()

